MUGISA WARREN DAVID
About:
I am a trained statistician data and business analyst with experience and skills in data and business analysis, financial modeling, data visualization, sales, monitoring and evaluation, resource mobilization, business development, and project planning and management the in-retail business, SME support, automobile industry, clean energy sector, and Agricultural sector.

PROJECTS
sample projects
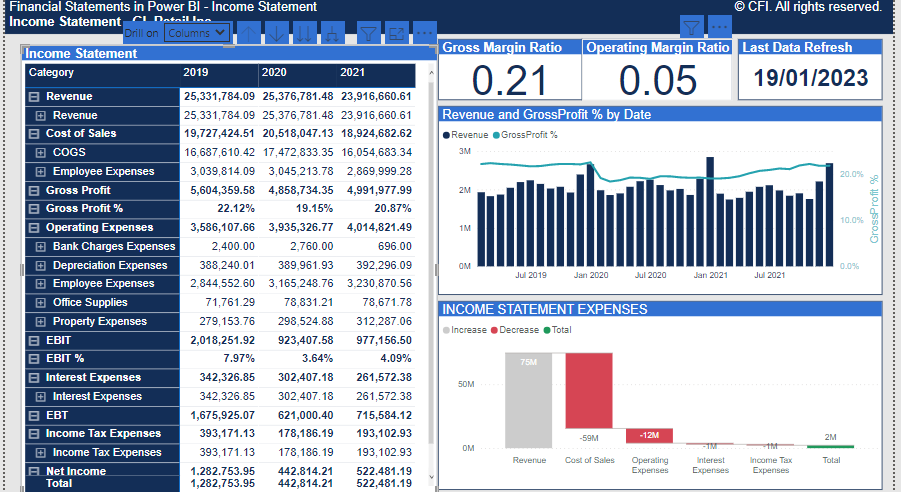
FINANCIAL ANALYSIS DASHBOARD
The aim of this project was to analyze the 3 financial statements of a company and offer users the ability to look at the financial data over the 3 periods of time with the ability to dive into a monthly weekly and daily analysis. This offered users to look at trends in the financial data and possible areas of investigation. The data was queried from a Microsoft Azure server and connected to power query for transformation before it was analyzed and visualised using Power BI
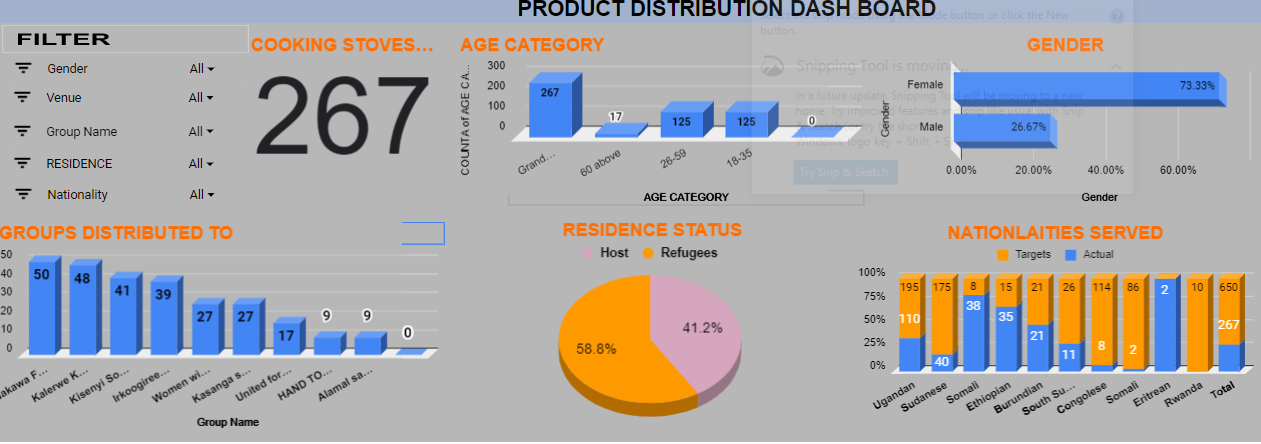
CLEAN ENERGY DISTRIBUTION DASHBOARD
During the distribution of clean energy products (Stove, brickets and cooking baskets) I was tasked with handling data management of the project and tracking key areas with the help of Google form and google sheets I developed a cost-effective way of tracking real-time progress of the project using the above dashboard that informed project implementation and reporting.
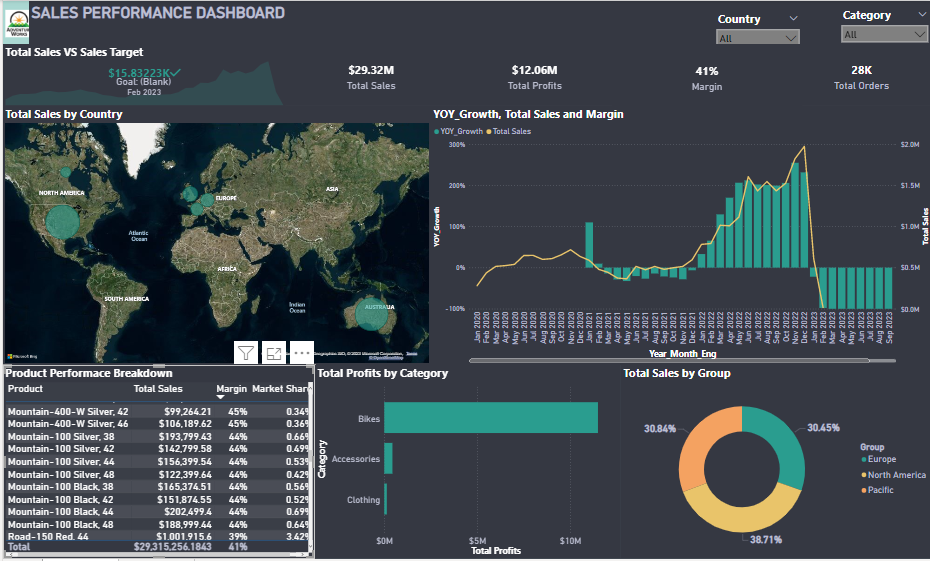
SALES DASHBOARD
Using sample data from an SQL database I analyzed data from Adventure Works Company with the aim of coming up with a sales performance dashboard that showed the current product market demand and how it varies per region, the current sales performance as a comparison of the past year performances and industry benchmarks and lastly the current market share of the company's products.
The data cleaning and exploratory data analysis were done using SQL with the development of data table views which were queried into Power Bi for further analysis and visualization.
3.PNG)
SALES TREND ANALYSIS(TABLEAU DESKTOP)
This project was based on data that belongs to a fictional e-commerce company called The Office Store. Products were grouped into three segments serving the needs of General Consumers, as well as Corporate and Home Offices. The company sold a wide variety of products including Office Supplies, Furniture, and Technology products, and sells exclusively online and has no physical stores with products being manufactured in Canada and the United States.
The aim of the project was a make an analysis of their sales and production data and identify key trends from the data with the development of two interactive dashboards that managers could use to track and identify trends in the data by country, product, and category.
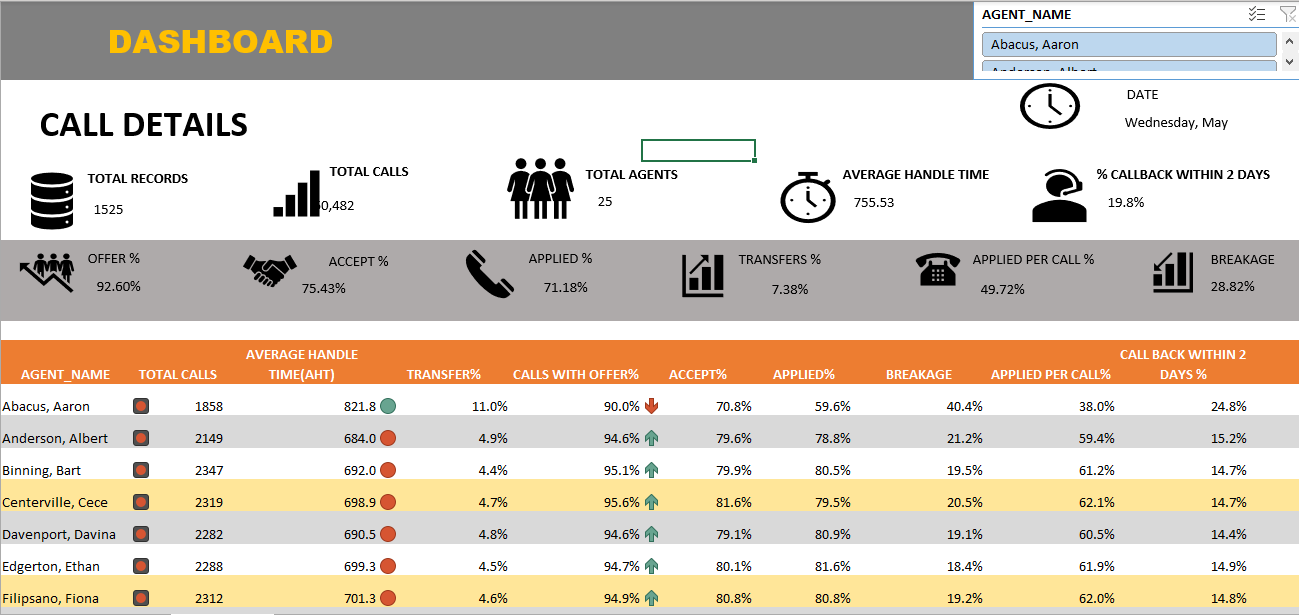
CALL CENTER DATA ANALYSIS AND DASHBOARD
This was an analysis of data from a call center with the aim of providing a dashboard that could support users to track the performance of agents and also determine the success rate of calls with the number of offers accepted by customers. This offered the ability to see the performance of the call center wholely as a unit and individually per agent. Data was loaded and cleaned using power query with relationships and measures being made with power pivot in Excel that helped in the making of tables and Key data points.
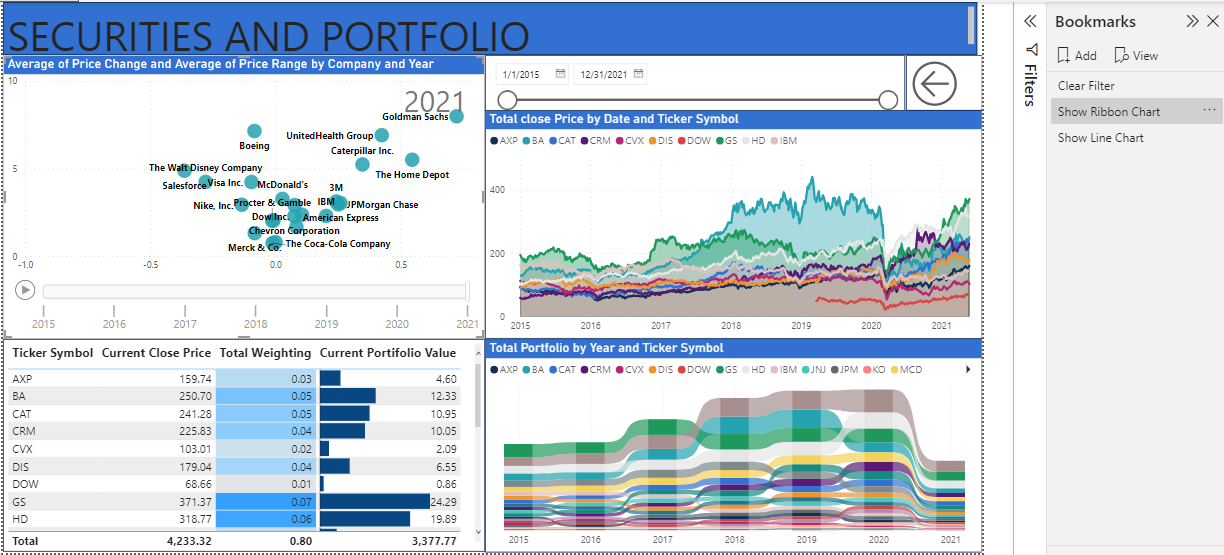
SECURITIES AND EXCHANGE ANALYSIS AND REPORT
With this project, I was tasked to analyze data from a trading company looking at different prices, exchange values, and portfolio values for different securities in the united states. Data were cleaned and aggregated from 3 separate sources and analyzed using power bi.
Cards Section Title
The section subtitle
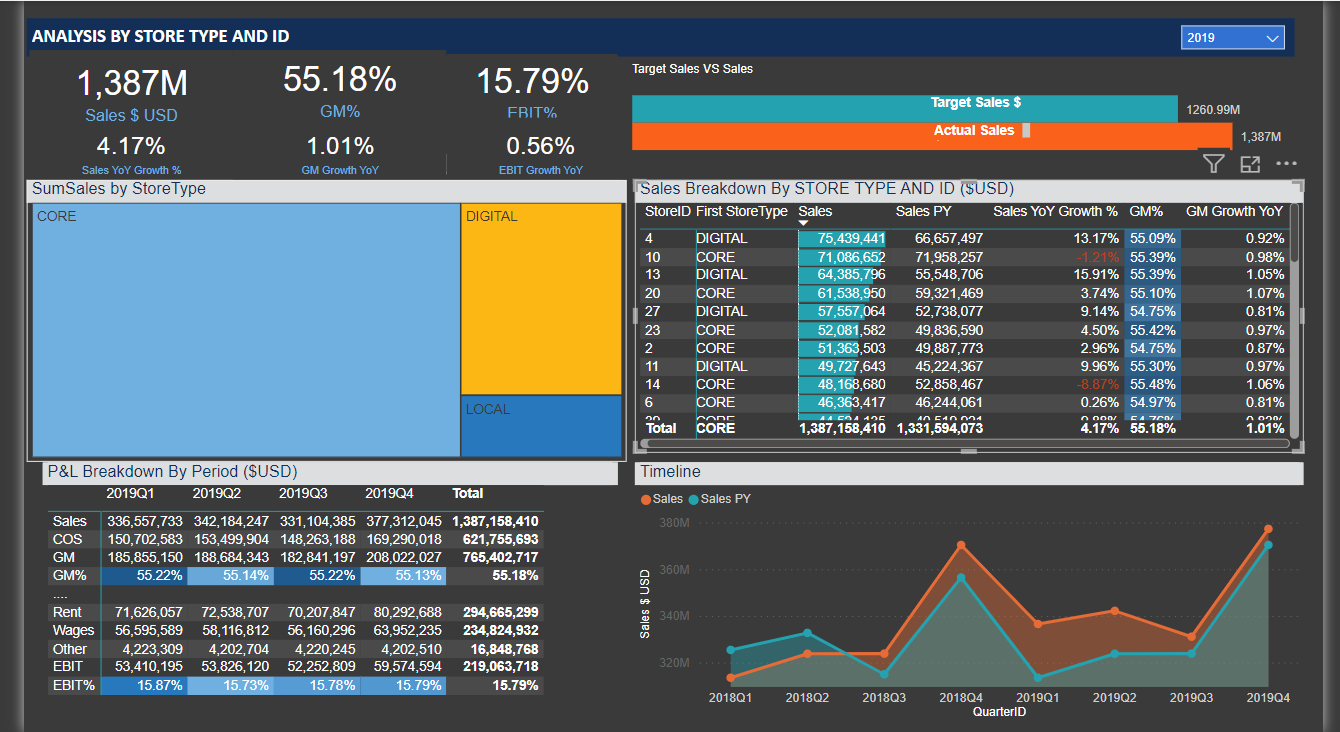
BUSINESS FINANCIAL AND SALES DATA ANALYSIS
In my recent project, I dove into a comprehensive dataset containing sales, financials, expenses and store information to uncover valuable insights. Here's a sneak peek at what we discovered:
1️⃣ Sales Performance: Identified strong sales growth trends throughout the year, with Q4 2019 standing out as a high-performing quarter.
2️⃣ Store Insights: Found that "CORE" store types dominated in terms of revenue.
3️⃣ Financial Health: Developed a simple Profit and Loss Statement showing company Margins and EBIT with Key KPI showing their annual growth and year-over-year changes.
4️⃣ Category Analysis: Pinpointed top-performing product categories and their impact on overall sales.
5️⃣ Location Matters: Uncovered regional variations in sales performance, providing valuable geographic insights.

